5The Boltzmann machine: learning meets the partition function
Recommended reading
Core (~1 h).Ackley, Hinton, and Sejnowski (1985) — the founding paper, and the source of this lecture’s vocabulary: the stochastic network, the two-phase learning rule (their “positive” and “negative” phases), and the observation that the model expectation must be estimated by sampling. Read it for the learning rule and the phase language; the partition-function obstruction is written between its lines, and today we make it explicit. Alongside it, Mehta et al. (2019), §VII — the physicist’s telling, in the notation this course uses; the moment-matching reading of the learning rule is cleanest there.
Optional background.MacKay (2003), Ch. 43, for the maximum-likelihood gradient done carefully from the inference side; Glauber (1963) for the single-spin-flip stochastic dynamics whose stationary law is Boltzmann — the \(T > 0\) dynamics teased at the end of Chapter 4, sourced (skim for the flip rule and detailed balance). Hinton (2002) is the subject of the next lecture.
Prerequisite reminder. Everything from Week 1 — the Boltzmann distribution and \(Z\) (Section 1.4), and the generating-function machinery of Chapter 2, where derivatives of \(\log Z\) produce expectations — and everything from Week 2: the network’s energy, the local field, the \(\langle \cdot \rangle\) bookkeeping. New today: stochastic dynamics and its stationary law, and couplings that are learned from data rather than written by Hebb.
5.1 From stored to learned couplings
Week 2 ended with a claim: replace the deterministic update Equation 3.1 by a coin flip — flip spin \(k\) with probability \(1/(1 + e^{\beta \Delta E})\) — and two things follow. First, the stationary distribution of this dynamics is exactly Week 1’s Boltzmann law over the network’s energy. Second, the moment we ask the network to learn its couplings from data by maximum likelihood — rather than have Hebb write them by fiat — the gradient acquires a term that requires \(Z\). Both are proved below.
Week 2 opened on the Hopfield half of the 2024 Nobel Prize; today is the Hinton half. Ackley, Hinton, and Sejnowski (1985) took Hopfield’s Ising network, made it stochastic, gave it a learning algorithm, and named the result after the distribution at its heart: the Boltzmann machine. The lineage traced in Chapter 1 thus closes its longest loop — Boltzmann’s counting in the 1870s, Gibbs’s partition function in 1902, Hopfield’s landscape in 1982, and now, 1985, a machine that carries Boltzmann’s name and learns a probability distribution from examples. In physical terms the machine is an Ising model with Glauber dynamics, and its obstruction is a partition function.
The question is one step past Week 2’s. That network remembered what we wrote into it — Hebb’s rule Equation 3.4 is a storage prescription, not a learning algorithm. Can a network learn what to remember — discover its own couplings from data alone? It can, by a rule that takes a few lines of calculus to derive, and the rule contains the obstruction the course is organized around: \(Z\), named in Chapter 1 as the training obstruction of Module 1, is here derived and pinned to a precise mathematical object.
Module 1’s arc is measure \(E\) (Week 1) → design \(E\) (Week 2) → learn \(E\) (Week 3), and this lecture completes it. A deeper symmetry runs through the argument: Week 1 derived the Boltzmann distribution from maximum entropy with the energy given (Section 1.4); here we run that derivation backwards — the data supply the constraints, and out fall both the learning rule and its obstruction.
Take-home 1
A Boltzmann machine is Week 2’s network heated up (Glauber dynamics \(\Rightarrow\) Boltzmann stationary law) and made trainable (couplings fit to data by maximum likelihood). Memorizing — Hebb, one shot, no objective — becomes learning: gradient ascent on the likelihood. The step from design to learn is the step that brings in \(Z\).
5.2 Memorize versus learn
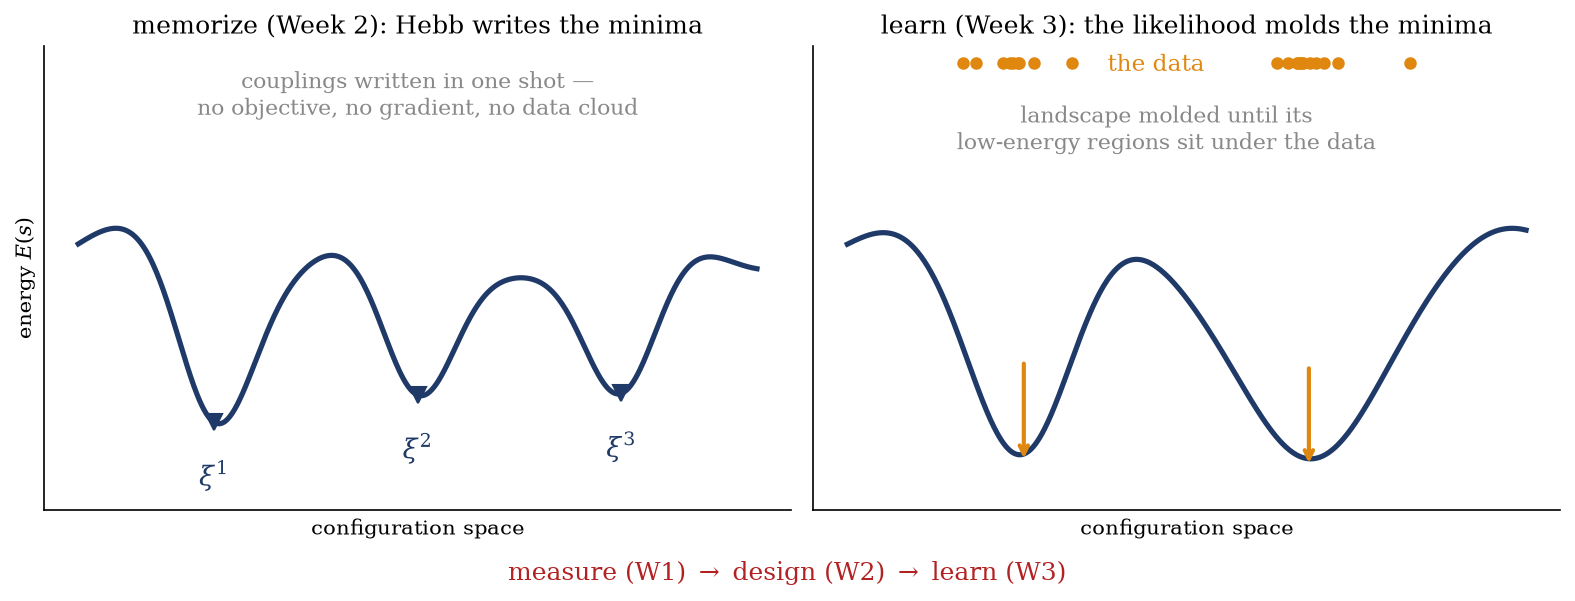
The first dichotomy of the lecture is memorize versus learn, drawn in Figure 5.1. Hebb’s rule Equation 3.4 writes the couplings in a single pass over the patterns: no objective function to descend and no iteration — the minima of the landscape are placed, once, at prescribed locations. Maximum likelihood inverts the logic. We posit a model distribution\(p(s) = e^{-\beta E(s)}/Z\) whose energy carries free parameters \((J, \theta)\), and we choose those parameters to maximize the probability the model assigns to the training data. The couplings are no longer written; they are fit, and the landscape is molded — iteratively, under an objective — until its low-energy regions sit under the data. Hebb, in this light, is a special, cheap, often-suboptimal solution to a problem maximum likelihood poses properly; we will meet Hebb again inside the exact learning rule, as one of its two terms.
Figure 5.1: The module’s last turn: from couplings written to couplings fit. Left: Hebb (Week 2) places the minima at prescribed patterns \(\xi^\mu\) in one shot — no objective and no iteration. Right: maximum likelihood (this week) posits an energy with free parameters and molds the landscape under an objective until its basins sit beneath the data. The objective is the log-likelihood, and its gradient is the subject of this lecture — the two forces of Figure 5.2.
The second dichotomy is the one the rest of the course keeps returning to: positive phase versus negative phase. Every gradient we write today is a difference of two brackets — an average over the data (“what the world shows you”) and an average over the model (“what the network generates”). Hinton’s informal names, the wake phase and the sleep phase, are a serviceable mnemonic (not to be confused with the later wake–sleep algorithm for Helmholtz machines, Dayan et al. (1995), a different construction); positive and negative phase, the terms of Ackley, Hinton, and Sejnowski (1985), are the technical vocabulary we keep. One of the two brackets is trivial to compute; the other is the wall.
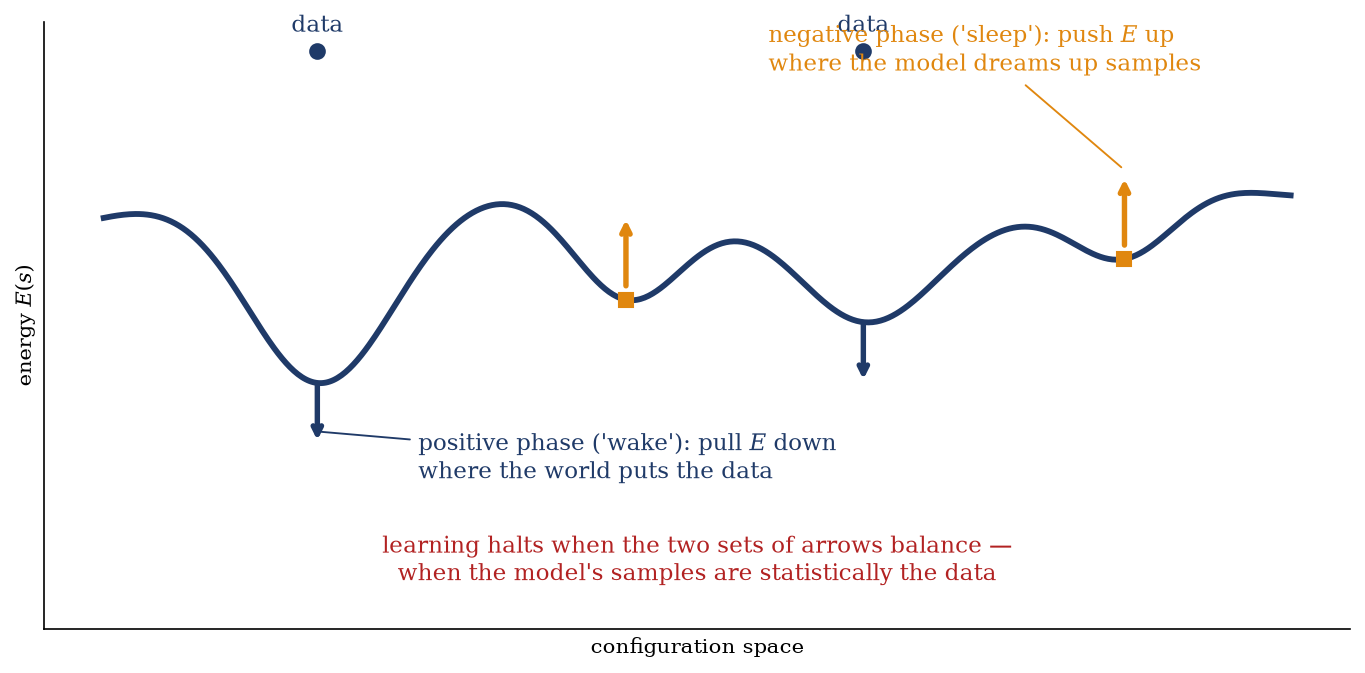
Figure 5.2 summarizes the lecture on a single energy landscape over configuration space. At each data point, an arrow pulls the energy down, making the observed configuration more probable. At each model sample, an arrow pushes the energy up, making the configurations the model generates on its own less probable. Learning halts when the two sets of arrows balance, which happens when the model reproduces the data’s means and pairwise correlations — the statistics the energy can express, not the full distribution. Training is down on data, up on dreams.
Figure 5.2: The two forces of training, drawn before the mathematics. Training a Boltzmann machine exerts two forces on the energy landscape: the positive (“wake”) phase pulls \(E\) down at the data, making the observed configurations more probable; the negative (“sleep”) phase pushes \(E\) up at the model’s own samples, making them less probable. The gradient we derive below is exactly this pair of forces, and learning stops when they balance — when the model’s means and pairwise correlations match the data’s. The negative arrows are the expensive ones: locating the model’s samples requires \(Z\).
Three results make this precise: ① the model distribution, and why it is Boltzmann (Section 5.3); ② the exact form of the two forces — the maximum-likelihood gradient (Section 5.4); ③ why the “up on dreams” force is the expensive one (Section 5.5).
5.3 Heating the network up, one spin at a time
The dynamics comes first. Week 2’s network ran at zero temperature — the update Equation 3.1 was the locally greedy choice, and the Lyapunov theorem of Section 3.4 guaranteed deterministic descent. Now heat it up. The energy is Week 2’s, with one addition: the thresholds we set to zero there return as learnable biases (physics dialect: local fields),
A notation flag before we move: \(\theta_i\) is a bias — one learnable parameter of the energy — and when we later write \(\nabla_\theta\) for “the gradient with respect to all parameters,” it ranges over the full collection \((J, \theta)\). As Chapter 1 warned, symbols will be overloaded; this is the first collision that matters.
One spin in the field of the others. Pick a site \(k\) at random — asynchronously, as in Week 2 — and hold every other spin fixed. The energy then depends on \(s_k\) only through \(-s_k h_k\), where \(h_k = \sum_j J_{kj} s_j + \theta_k\) is the local field (the field that ran the Lyapunov argument); everything else is a constant. With its environment frozen, spin \(k\) is Week 1’s two-state system of Section 1.6: two states \(s_k = \pm 1\) with energies \(\mp h_k\), a gap of \(2h_k\). Heating the network up means letting this one spin come to equilibrium at inverse temperature \(\beta\) in the field of its neighbors, that is, drawing its new value from the two-state Boltzmann occupation,
the logistic function of Section 1.6, here a conditional Boltzmann probability for one spin in the field of its neighbors. Read as a move from the current configuration, the redraw either leaves \(s_k\) unchanged or flips it. The flip \(s_k \to -s_k\) costs \(\Delta E_k = 2\, s_k h_k\), and the redrawn spin lands on \(-s_k\) with probability \(e^{-\beta s_k h_k}/(e^{\beta h_k} + e^{-\beta h_k})\), which is
Downhill moves are accepted with probability near one (\(w \to 1\) for \(\Delta E \ll -T\)), uphill moves with probability \(\approx e^{-\Delta E/T}\) for \(\Delta E \gg T\), never exactly zero, and as \(\beta \to \infty\) the rule collapses onto Week 2’s greedy \(\operatorname{sign}(h_k)\): the zero-temperature network is the cold limit of this one.
Detailed balance, in three lines. Each step equilibrates one spin against a frozen environment. Where does the whole network settle under many such steps? Consider two configurations \(s\) and \(s'\) that differ at the single site \(k\), and take the ratio of forward and backward flip probabilities. With \(\Delta E = E(s') - E(s)\), the reverse move costs \(-\Delta E\), so
— and a distribution satisfying detailed balance is stationary: the probability flowing out of any state along each single-flip edge is exactly balanced by the flow back in. In words: Week 1’s Boltzmann distribution has returned — but where Week 1 handed us the energy, here \(E\) carries free parameters we are about to fit, and \(Z\) is the normalizer we will spend the rest of the course working around. Heating the network up is what turns a memory into a probability distribution over configurations: the machine no longer sits in one minimum; it visits configurations with Boltzmann weights, and can be asked what it thinks is likely. The dynamics just built, repeated local equilibration of one spin at a time (the heat-bath rule), is Glauber dynamics(Glauber 1963).
Three remarks. Stationarity plus irreducibility (any state reachable from any state — true here, since every \(w > 0\) at finite \(T\)) and aperiodicity guarantee that the chain converges to Equation 5.3 from any start; asynchronous random-site updating supplies both, and we take the ergodic bookkeeping as read. How fast it converges — the mixing time — is an entirely separate matter, and we flag now that it returns as the second obstruction in Section 5.5. Finally, the temperature: \(\beta\) multiplies parameters we are about to learn, so it can be absorbed into them — a machine at \(\beta = 2\) with couplings \(J\) and biases \(\theta\) is the same model as a machine at \(\beta = 1\) with couplings \(2J\) and biases \(2\theta\). We set \(\beta = 1\) from here on and say so once.
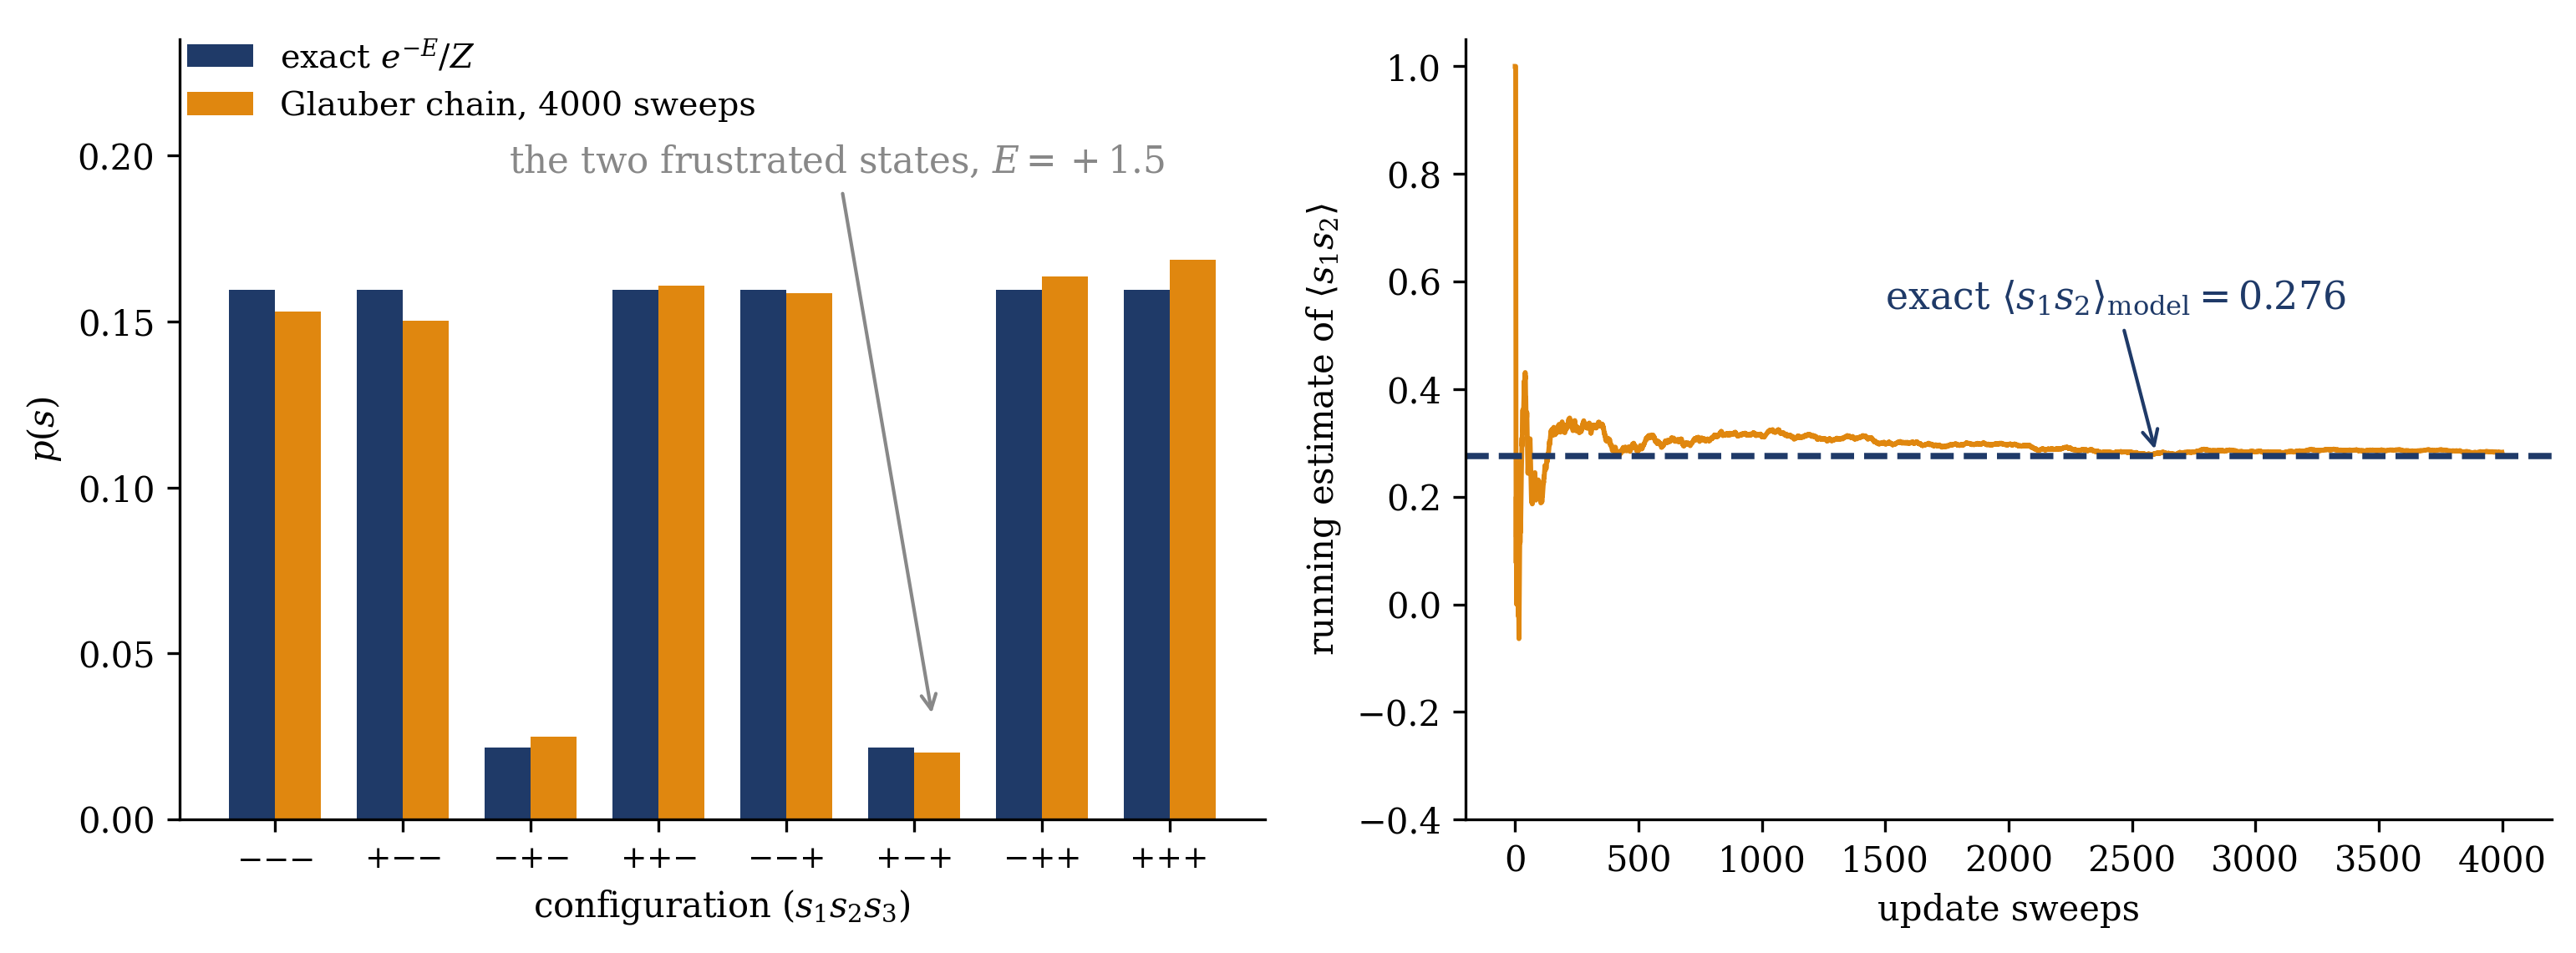
Figure 5.3 shows the theorem at work on a machine small enough to check exhaustively — three spins, the same frustrated triangle we dissect by hand in Section 5.7: the empirical visit frequencies of the Glauber chain converge onto the eight exact Boltzmann probabilities, and a running average over the chain converges onto the exact model expectation \(\langle s_1 s_2 \rangle_\text{model}\). The fluctuating line in the right panel — an expectation estimated by running the dynamics — is precisely the object the learning rule of Section 5.4 demands, once per gradient step.
Figure 5.3: Glauber dynamics finding the Boltzmann distribution, on the \(N = 3\) machine of Section 5.7 (\(J_{12} = J_{23} = 0.5\), \(J_{13} = -0.5\), \(\theta = 0\); \(Z = 10.34\)). Left: exact Boltzmann probabilities \(e^{-E(s)}/Z\) of the eight configurations (navy) against the visit frequencies of a single Glauber chain of \(4000\) sweeps (orange) — the six degenerate low-energy states at \(E = -0.5\) and the two frustrated states at \(E = +1.5\) are all reproduced. Right: the running chain estimate of \(\langle s_1 s_2 \rangle\) converging onto the exact model expectation \(0.276\) (dashed). This fluctuating estimate is exactly what the learning rule of Section 5.4 demands: a model expectation, re-estimated at every gradient step.
5.4 The maximum-likelihood gradient
To fit \((J, \theta)\) we need an objective and its gradient. The objective writes itself; but \(\log p\) contains \(-\log Z\), and \(Z\) depends on every parameter, so the gradient will contain \(\partial \log Z / \partial(J, \theta)\) — and that term will not go away. We meet it by computing it.
Setup. The data are \(D\) configurations \(\mathcal{D} = \{s^{(1)}, \dots, s^{(D)}\}\) — binarized images, spike patterns, spin snapshots — treated as independent draws. The (average) log-likelihood is
with \(\beta = 1\) absorbed as agreed. We climb \(L\) by gradient ascent, so we need its derivatives with respect to each coupling \(J_{ij}\) and each bias \(\theta_i\).
The coupling gradient, term by term. Differentiating the two pieces of \(\log p\) separately,
The first term is bookkeeping. In the energy Equation 5.1, the symmetric pair \((J_{ij}, J_{ji})\) is one parameter that appears twice in the double sum, and the \(\tfrac{1}{2}\) exists precisely to cancel that double count:
— a plain correlation, read off the training set in a single pass. The second term is the move you already know from Chapter 2, where differentiating \(\log Z\) with respect to \(\beta\) produced \(\langle E \rangle\): a derivative of \(\log Z\) is always an expectation. Here the derivative is with respect to a coupling instead of the temperature, and the same three steps give
— the same correlation, evaluated not over the data but over the model’s own distributionEquation 5.3. Assembling, and running the identical two-liner for the biases (\(-\partial E/\partial \theta_i = s_i\), and \(\partial \log Z/\partial \theta_i = \langle s_i \rangle_\text{model}\)):
This is the learning rule of Ackley, Hinton, and Sejnowski (1985). Gradient ascent, \(\Delta J_{ij} = \eta\, (\langle s_i s_j \rangle_\text{data} - \langle s_i s_j \rangle_\text{model})\), says: raise the coupling between two units that co-fire in the data more often than the model expects; lower it where the model over-predicts co-firing. The first term is Hebb — “fire together, wire together,” now averaged over data rather than written from patterns. The second is anti-Hebbian: unlearning applied to the network’s own samples. Hebb’s rule of Week 2 is thereby exposed as the positive phase running without its counterweight — which suggests why it over-writes and interferes (Section 4.2), and why it tops out at \(\alpha_c \approx 0.138\) while optimally chosen couplings reach Gardner’s \(\alpha = 2\) (Gardner (1988)). The two terms are the two arrow sets of Figure 5.2, and learning stops when they cancel.
Differentiating Equation 5.4 once more gives the Hessian \(\partial^2 L / \partial J_{ij}\, \partial J_{kl} = -\big( \langle s_i s_j s_k s_l \rangle_\text{model} - \langle s_i s_j \rangle_\text{model} \langle s_k s_l \rangle_\text{model} \big)\) — minus a covariance matrix, which is negative semidefinite. The log-likelihood of a fully visible Boltzmann machine is therefore concave in \((J, \theta)\): every local maximum is global. It follows that the problem we are about to declare intractable is intractable for one reason only, the cost of the negative phase, and not also because of a rugged objective. (Hidden units, in Section 5.6, break the concavity; the clean case is the fully visible one.)
Both the sum and its normalizer run over all \(2^N\) configurations of the network. This is precisely the object Chapter 1 named on day one — “the Boltzmann machine cannot be trained because \(\nabla_\theta \log Z\) is intractable” — is now derived: the gradient of the log-likelihood is, in its second term, the parameter-gradient of \(\log Z\).
Set the two phases side by side and the asymmetry is stark. The positive phase\(\langle s_i s_j \rangle_\text{data}\) is a sum over \(D\) training points — linear in the dataset, one pass, trivial. The negative phase is a sum over \(2^N\) model configurations, normalized by \(Z\) — exponential in the system. And there is no clever reparameterization that removes it: the term exists because the model is normalized. Any \(p\) that integrates to one carries \(-\log Z\) in its log-likelihood, and any parameter that shapes the landscape moves \(Z\). Learning forces the model expectation into the gradient; this asymmetry — cheap data averages, exponential model averages — recurs in every training method from here on.
Trap
The negative phase is not a statistic of the data.\(\langle s_i s_j \rangle_\text{model}\) is an expectation over the model’s own distribution — which shifts at every gradient step, because the parameters just moved. It must be re-estimated, from scratch or by clever warm-starting, at every update. Computing it once and reusing it turns the negative phase into a constant: the gradient no longer responds to the model, nothing stops the update, and the parameters drift without bound along the data statistics. Conflating it with a data correlation is worse still — the gradient is identically zero and nothing is learned.
Maximum entropy, run backwards. At the optimum the gradient Equation 5.4 vanishes, so
\[
\langle s_i s_j \rangle_\text{model} = \langle s_i s_j \rangle_\text{data}
\quad \text{and} \quad
\langle s_i \rangle_\text{model} = \langle s_i \rangle_\text{data}
\quad \text{for all } i, j.
\tag{5.6}\]
moment matching at the optimum
The trained machine reproduces the data’s first and second moments exactly — and it does so with a distribution of the Boltzmann form \(p \propto \exp\big( \sum_i \theta_i s_i + \tfrac{1}{2}\sum_{i\neq j} J_{ij} s_i s_j \big)\), which is exactly the functional form that maximum entropy produces when the constrained observables are \(\{s_i\}\) and \(\{s_i s_j\}\). The parallel with Section 1.4 is exact: there, we maximized entropy subject to a known mean energy, and \(\beta\) emerged as the Lagrange multiplier enforcing the constraint. Here, the constraints are the data’s moments, and the multipliers enforcing them are precisely the biases and the couplings. Training a fully visible Boltzmann machine is Jaynes’s derivation run backwards(Jaynes 1957): among all distributions matching the data’s first two moments, gradient ascent on the likelihood finds the one of maximum entropy, and \((\theta, J)\) are its Lagrange multipliers. The course’s opening derivation and its first learning algorithm are one theorem seen from two sides.
The duality, made explicit. The correspondence is exact, and the derivation explains structurally why the learning rule has the form it has (Welling, Lu, and Holdijk 2026, ch. 1 on convex duality). Pose Jaynes’s problem with the data’s moments as the constraints: among all distributions \(p(s)\), maximize the entropy \(S[p] = -\sum_s p \log p\) subject to \(\langle s_i \rangle_p = \langle s_i \rangle_\text{data}\), \(\langle s_i s_j \rangle_p = \langle s_i s_j \rangle_\text{data}\), and normalization. Attach one multiplier per constraint — \(\theta_i\) to each mean, \(J_{ij}\) to each correlation (the names are not an accident), \(\lambda\) to the normalization — and write the Lagrangian
Stationarity in \(p\) is one functional derivative, exactly as in Section 1.4: \(\delta \mathcal{L} / \delta p(s) = -\log p(s) - 1 + \sum_i \theta_i s_i + \tfrac{1}{2} \sum_{i \neq j} J_{ij} s_i s_j - \lambda = 0\), solved by \(p(s) = e^{-E(s)}/Z\) with \(E\) the machine’s energy Equation 5.1 — the model distribution Equation 5.3, its couplings and biases now revealed as the multipliers. What remains is the multipliers’ own optimization. Substitute the stationary \(p\) back: \(-\log p = E + \log Z\) turns the entropy into \(\langle E \rangle_p + \log Z\), the moment terms assemble to \(-\langle E \rangle_p\) minus the data sums, and the Lagrangian collapses to the dual function
the dual of maximum entropy is the negative log-likelihood
which is the negative of the log-likelihood of Section 5.4, term for term (\(\langle -E \rangle_\text{data}\) is precisely the two moment sums). Maximum entropy is the primal problem; maximum likelihood is its dual, and since the dual of a maximization upper-bounds it, the dual problem minimizes\(\mathcal{L}_\text{D}\) — that is, maximizes the likelihood. Gradient descent on the dual adjusts each multiplier until its constraint is satisfied, \(\partial \mathcal{L}_\text{D} / \partial \theta_i = \langle s_i \rangle_\text{model} - \langle s_i \rangle_\text{data}\), and that is the learning rule Equation 5.4, component by component. The moment matching Equation 5.6 is then the primal constraints, enforced by their multipliers. Even the concavity of Section 5.4 has a structural origin here: a dual function is convex whatever the model (the covariance Hessian computed there is the general theorem’s local face), and because the entropy is concave and the constraints affine in \(p\), strong duality holds — the two problems share one optimum with no gap. Week 1’s \(\beta\), the single multiplier that enforced \(\langle E \rangle = U\), was the one-parameter preview of this dictionary; the Boltzmann machine simply runs it with \(N + \binom{N}{2}\) constraints at once.
First, the KL reading, in one line: since \(\langle \log p \rangle_\text{data}\) differs from \(-D_\mathrm{KL}(p_\text{data} \| p_\text{model})\) only by the data’s own entropy, which contains no parameters, maximizing the likelihood is minimizing the Kullback–Leibler divergence from the data to the model. This is the first appearance of the variational object Module 2 is built on, and the free-energy/KL identity deferred in Week 1 is developed in full there.
Second, knowing the value of \(Z\) at the current parameters would not help: the negative phase needs its gradient, which is again a \(2^N\) sum, so the natural estimator is the one Ackley, Hinton, and Sejnowski (1985) already proposed: run the Glauber chain of Section 5.3 to equilibrium and average — the right panel of Figure 5.3, per gradient step. But the model whose landscape you are sampling is an Ising network with learned, heterogeneous couplings — exactly the terrain Week 2 showed can be rugged, with exponentially many metastable minima (Section 4.5). A chain started anywhere must mix across energy barriers to visit the distribution fairly, and on a rugged landscape mixing can itself take exponential time. The course now carries two obstructions: normalization — \(Z\) and its parameter-gradient, the through-line since Week 1 — and sampling: even evading the sum, you must draw fair samples from a distribution you cannot normalize, on a landscape built to have many basins. Module 2 attacks the first by approximation; Module 3 is devoted to the second; Module 4 removes both for generative modeling. Both appear together in Equation 5.5.
Take-home 2
The negative phase is\(\partial \log Z / \partial J_{ij}\) — a sum over \(2^N\) model configurations, the obstruction Week 1 promised, now derived. It cannot be reparameterized away (it comes with normalization), must be re-estimated at every step, and even its sampling estimator runs into a second wall: mixing on a rugged landscape. At the optimum, model moments equal data moments — training a Boltzmann machine is maximum entropy with the data’s moments as constraints, and \((\theta, J)\) are the Lagrange multipliers.
5.6 Hidden units: expressivity and a second expectation
One generalization is needed for the next lecture, and we state it result-first. A notation collision is unavoidable: from here, \(h\) denotes a hidden unit, not the local field \(h_k\) of Section 5.3. With a site index in a discussion of dynamics, \(h_k\) is the local field; plain \(h\) and \(h_j\) in the visible/hidden split are latent units.
The fully visible machine has a structural ceiling built into Equation 5.6: it matches first and second moments, and nothing else — it is second-order maximum entropy, blind to any higher-order structure in the data (three-way correlations, parity constraints, the composition rules of images). The fix is the standard physical move: add degrees of freedom you do not observe, and trace them out. Split the units into visible units \(v\) — carrying the data — and hidden units \(h\), with a joint energy \(E(v, h)\) of the same pairwise form Equation 5.1 over the concatenated system, and let the model of the data be the marginal
\[
p(v) \;=\; \frac{1}{Z} \sum_h e^{-E(v, h)}.
\]
Marginalizing over \(h\) induces effective interactions of every order (up to the number of visibles) among the visibles — integrate out a shared hidden neighbor and its visible partners inherit couplings beyond pairwise — so the machine is strictly more expressive at fixed visible count. (The modern reach of this expressivity — energy-based models with deep energies, and the identification of attention with a Hopfield energy — is Week 4’s subject.)
The gradient keeps its two-phase shape, but its positive phase changes origin. The log-likelihood of a data point is now the logarithm of a sum,
and the first term has the same structure as the second: \(Z(v) \equiv \sum_h e^{-E(v, h)}\) is the partition function of the hidden units alone, with the visibles held fixed at \(v\). (Its logarithm is minus the free energy \(F(v)\) of the next lecture.) The move of Section 5.4, that a derivative of \(\log Z\) is an expectation, therefore applies to both terms. For a visible–hidden coupling \(W_{ij}\), with \(-\partial E / \partial W_{ij} = v_i h_j\),
where the ratio \(e^{-E(v, h)} / Z(v)\) is the conditional \(p(h \mid v) = p(v, h) / p(v)\), because the global \(Z\) cancels between numerator and denominator. The second term gives \(\langle v_i h_j \rangle_\text{model}\) exactly as before, now over the joint \(p(v, h)\). Averaging over the \(D\) training points,
The clamped average is an expectation under \(p_\text{data}(v)\, p(h \mid v)\): the data supply the visibles, and the model supplies the hidden units the data do not specify. It is still an average over the training set, taken of \(\langle v_i h_j \rangle_{h \mid v}\) instead of the bare product \(v_i h_j\); without hidden units the conditional is trivial and Equation 5.4 returns. (Much of the RBM literature writes this bracket \(\langle v_i h_j \rangle_\text{data}\); we keep clamped, because the hidden units are not in the data.)
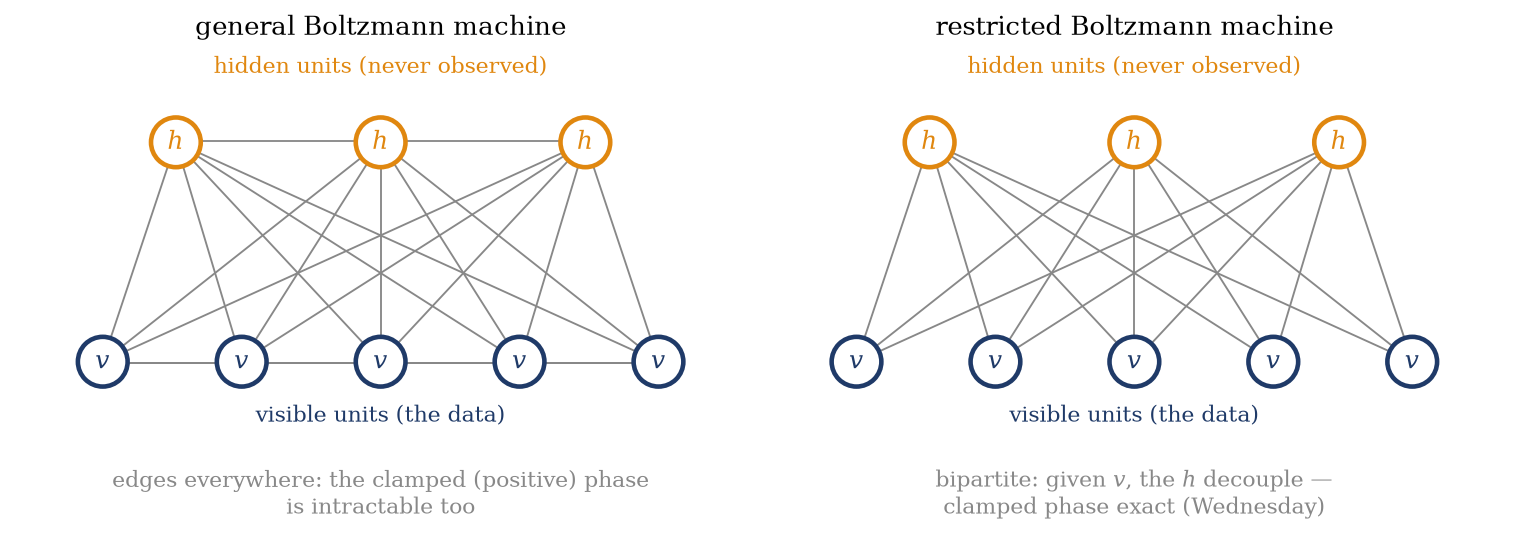
The first bracket has nonetheless changed character. The hidden units are never observed, so the positive phase is no longer a lookup but an inference problem inside the learning loop. For a general graph (Figure 5.4, left), the conditional \(p(h \mid v)\) couples all the hidden units to each other, and \(Z(v)\) is a sum over all \(2^{N_h}\) configurations of the \(N_h\) coupled hidden units, itself intractable. Hidden units thus add a second hard expectation on top of the \(Z\) wall — and, as flagged in Section 5.4, they break the concavity of the objective as well.
Figure 5.4: Hidden units, and the restriction that will save the positive phase. Left: a general Boltzmann machine — visible units (data) and hidden units (latent), undirected couplings everywhere, including within each layer; the clamped conditional \(p(h \mid v)\) couples the hidden units to each other and is intractable. Right: the restricted Boltzmann machine — couplings only between the layers. Given the visibles, the hidden units decouple, the clamped (positive) phase factorizes exactly, and a whole layer can be sampled in parallel. The bipartite restriction and what it buys are the next lecture’s subject.
The next lecture addresses both problems. ① Make the positive phase exact by architecture: forbid within-layer couplings, so that given \(v\) the hidden units decouple and \(p(h \mid v)\) factorizes — the restricted Boltzmann machine (Figure 5.4, right). ② Make the negative phase cheap by approximation: replace the equilibrated model average with a short Gibbs chain started at the data — contrastive divergence(Hinton 2002). Why a deliberately unconverged chain gives a usable gradient is a genuine question, taken up in the next lecture.
Take-home 3
Hidden units add expressive power, since marginalizing latents induces effective interactions of all orders among the visibles, but they introduce a second hard expectation: the clamped positive phase \(\langle \cdot \rangle_{p(h \mid v)}\), intractable for a general graph (and concavity is lost). The bipartite restriction (RBM) makes the clamped phase exact; contrastive divergence approximates the negative phase; both are covered in the next lecture. \(Z\) itself remains, for Module 4.
5.7 Example: the \(Z\) ledger
We compute the negative phase exactly for one small machine and then scale it up. Take \(N = 3\) spins, couplings \(J_{12} = J_{23} = 0.5\), \(J_{13} = -0.5\), biases \(\theta = 0\) — the machine already running in Figure 5.3. The product of couplings around the triangle is negative, so the loop is frustrated — no configuration can satisfy all three bonds at once (satisfying all three would cost \(E = -1.5\); the true ground states make do with \(-0.5\)). The negative phase asks for \(\langle s_1 s_2 \rangle_\text{model}\), and at \(N = 3\) we simply enumerate all \(2^3 = 8\) configurations:
\(s_1\, s_2\, s_3\)
\(E(s)\)
\(e^{-E}\)
\(s_1 s_2\, e^{-E}\)
\(+\,+\,+\)
\(-0.5\)
\(1.649\)
\(+1.649\)
\(+\,+\,-\)
\(-0.5\)
\(1.649\)
\(+1.649\)
\(+\,-\,+\)
\(+1.5\)
\(0.223\)
\(-0.223\)
\(+\,-\,-\)
\(-0.5\)
\(1.649\)
\(-1.649\)
\(-\,+\,+\)
\(-0.5\)
\(1.649\)
\(-1.649\)
\(-\,+\,-\)
\(+1.5\)
\(0.223\)
\(-0.223\)
\(-\,-\,+\)
\(-0.5\)
\(1.649\)
\(+1.649\)
\(-\,-\,-\)
\(-0.5\)
\(1.649\)
\(+1.649\)
Six degenerate low-energy states — the frustrated loop’s signature, and Week 2’s rugged-landscape story in miniature — and two high-energy ones. Summing the columns: \(Z = 6\, e^{0.5} + 2\, e^{-1.5} = 10.34\), and
— the number the Glauber chain of Figure 5.3 converges to. The negative phase is a completely well-defined, completely mechanical sum: eight energies, eight exponentials, one division. If the data were to report, say, \(\langle s_1 s_2 \rangle_\text{data} = 0.50\), the learning rule Equation 5.4 says \(\partial L / \partial J_{12} = 0.50 - 0.276 = +0.224\): strengthen the coupling, re-enumerate, repeat. Nothing about the rule is hard.
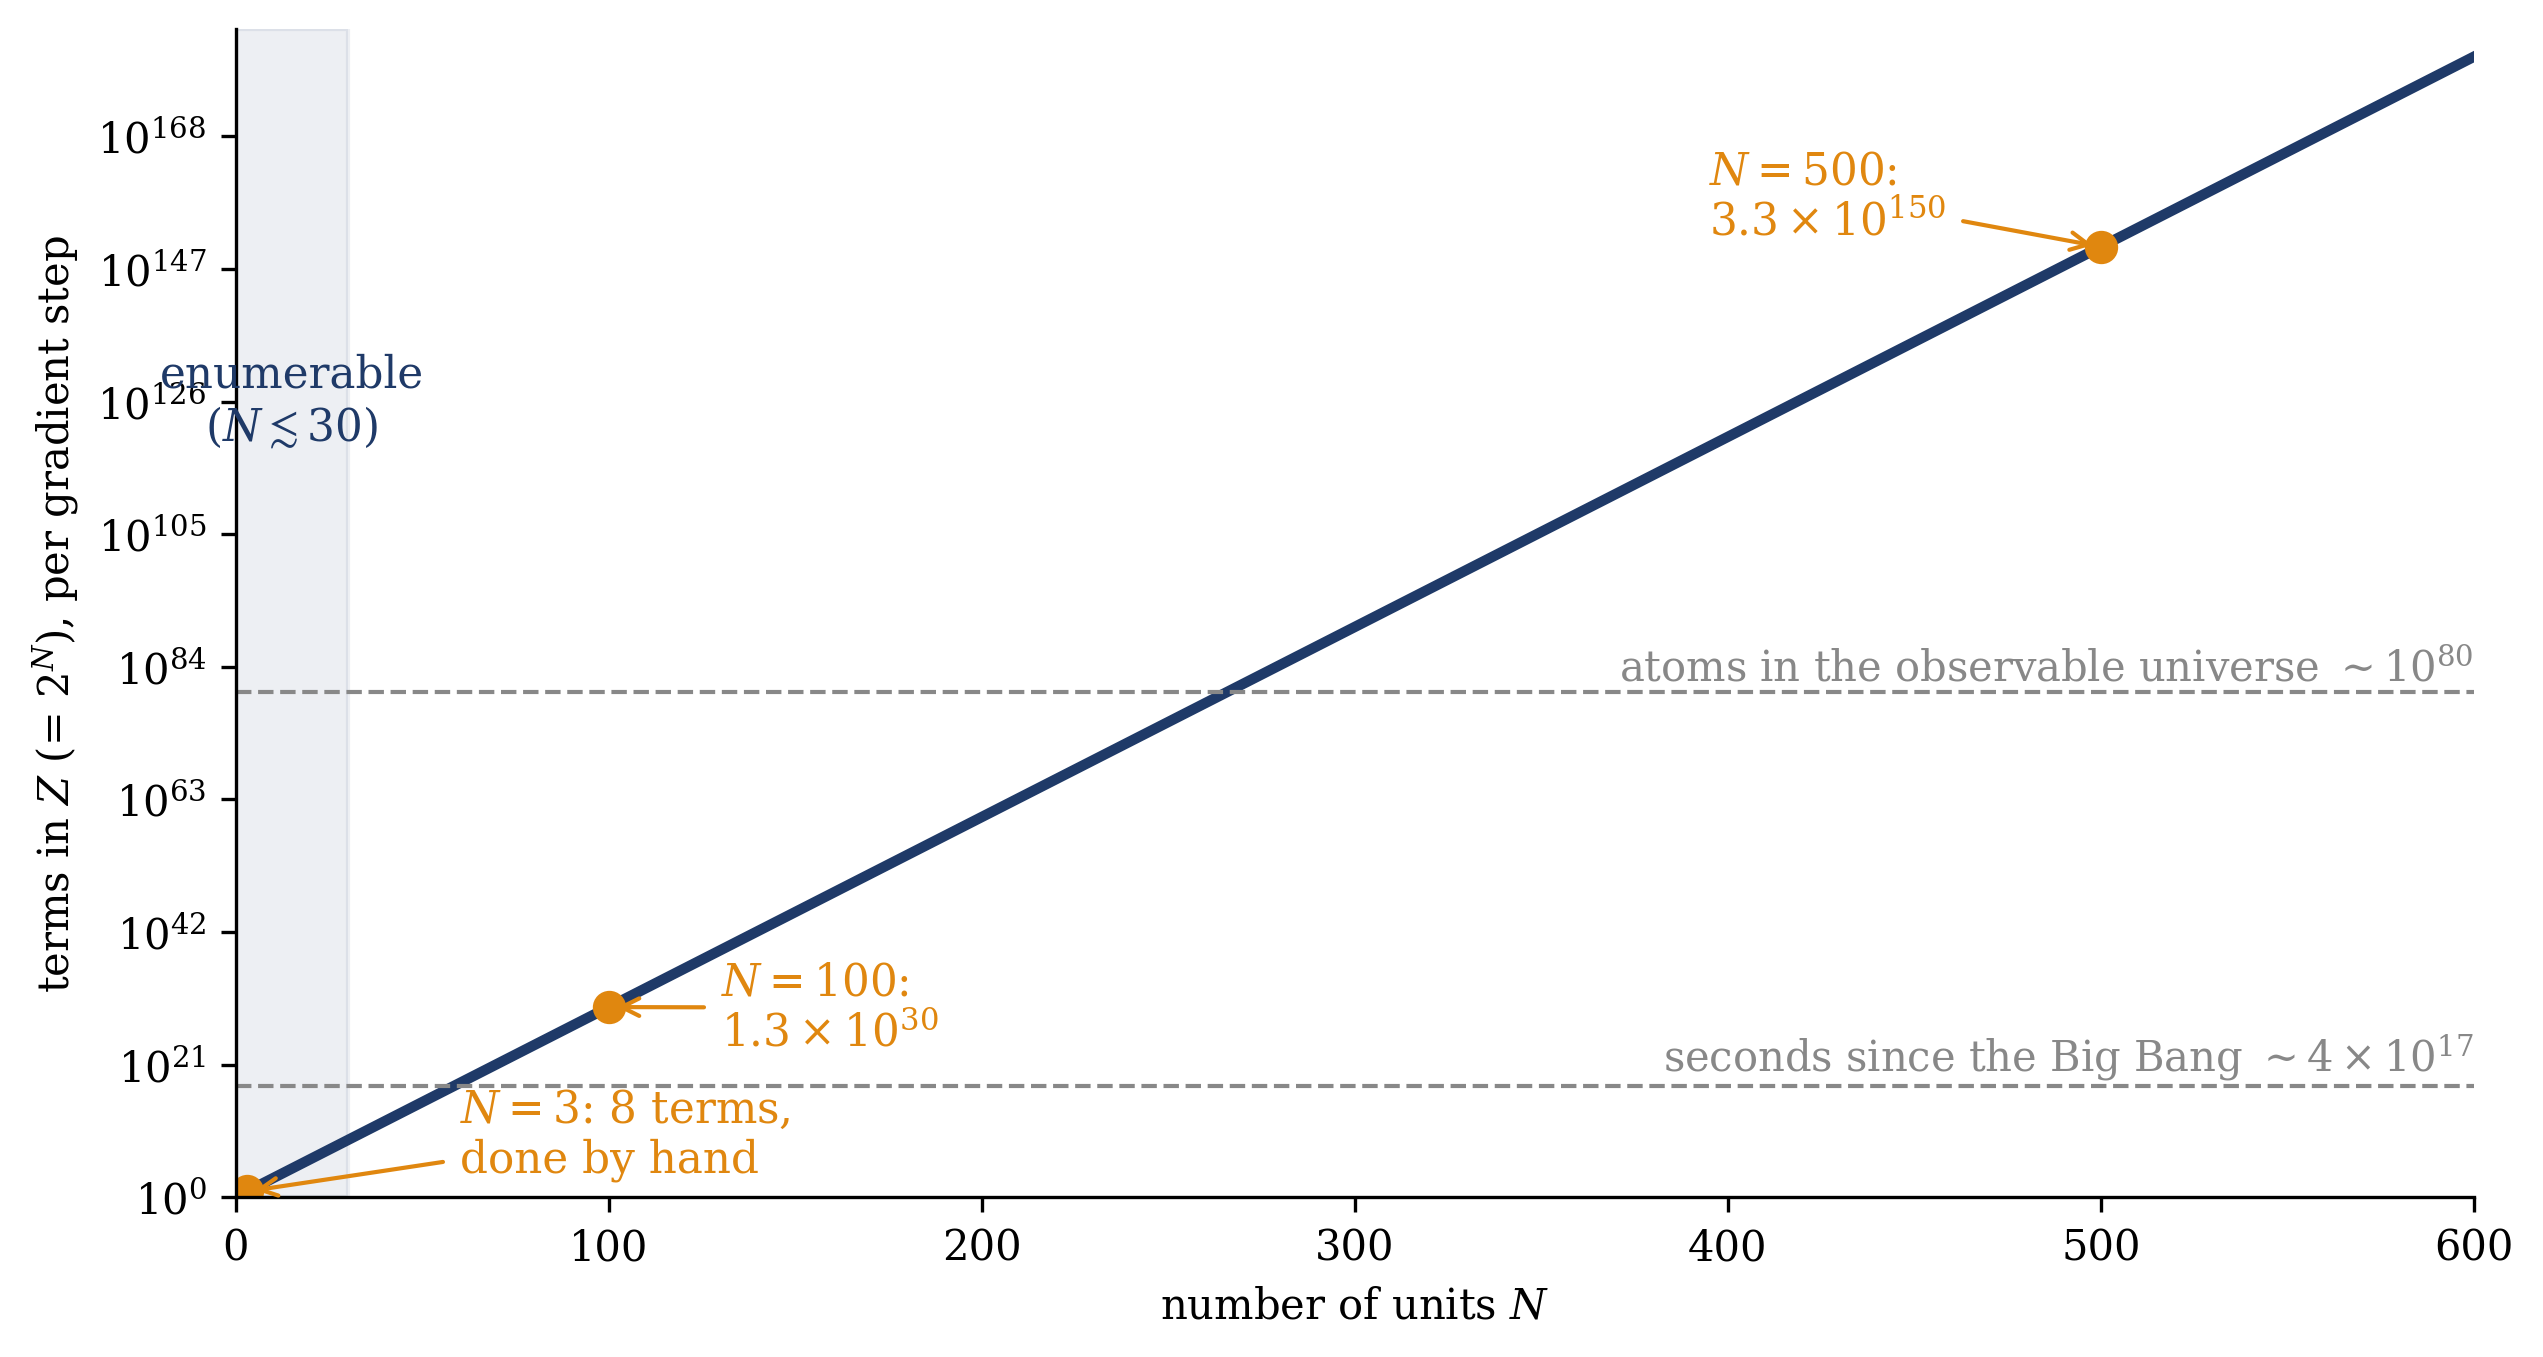
Now scale it. The number of terms in \(Z\) — and in every negative-phase expectation, at every gradient step — is \(2^N\):
\(N\)
\(2^N\) terms in \(Z\)
feasibility
\(3\)
\(8\)
done by hand above
\(10\)
\(1{,}024\)
a laptop, instantly
\(20\)
\(\sim 1.05 \times 10^{6}\)
a laptop, seconds
\(30\)
\(\sim 1.07 \times 10^{9}\)
a compute-bound minute — the practical ceiling for brute force
\(100\)
\(\sim 1.27 \times 10^{30}\)
more terms than seconds since the Big Bang (\(\sim 4 \times 10^{17}\))
\(500\)
\(\sim 3.3 \times 10^{150}\)
more terms than atoms in the observable universe (\(\sim 10^{80}\))
The last two rows set the scale. A machine of \(100\) units — not a large model; a thumbnail image — asks, for its exact negative phase, for more terms than there have been seconds since the Big Bang. At \(500\) units the count dwarfs the atom inventory of the observable universe. And this is not a one-time cost: the trap of Section 5.5 says the sum is owed per gradient step, because the distribution under the bracket moves with the parameters. Figure 5.5 draws the scaling.
Show code
N = np.arange(1, 601)fig, ax = plt.subplots(figsize=(8.6, 4.6))ax.semilogy(N, 2.0**N, color=NAVY, lw=2.5)ax.axvspan(0, 30, color=NAVY, alpha=0.08)ax.text(36, 1e115, "$\\leftarrow$ enumerable ($N \\lesssim 30$)", color=NAVY, fontsize=10.5, ha="left")ax.axhline(4.4e17, color=GRAY, ls="--", lw=1)ax.text(600, 1.5e18, "seconds since the Big Bang $\\sim 4\\times 10^{17}$", color=GRAY, fontsize=10, ha="right", va="bottom")ax.axhline(1e80, color=GRAY, ls="--", lw=1)ax.text(600, 3e80, "atoms in the observable universe $\\sim 10^{80}$", color=GRAY, fontsize=10, ha="right", va="bottom")for n, lab, xy in [(3, "$N=3$: 8 terms,\ndone by hand", (60, 1e4)), (100, "$N=100$:\n$1.3\\times 10^{30}$", (130, 1e24)), (500, "$N=500$:\n$3.3\\times 10^{150}$", (395, 3e152))]: ax.plot([n], [2.0**n], "o", color=ORANGE, ms=7) ax.annotate(lab, xy=(n, 2.0**n), xytext=xy, color=ORANGE, fontsize=10.5, arrowprops=dict(arrowstyle="->", color=ORANGE, lw=1))ax.set_xlabel(r"number of units $N$")ax.set_ylabel(r"terms in $Z$ (= $2^N$), per gradient step")ax.set_xlim(0, 600); ax.set_ylim(1, 1e185)fig.tight_layout(); plt.show()
Figure 5.5: The \(Z\) wall: the number of terms in the partition function — and in every exact negative-phase expectation, at every gradient step — against the number of units \(N\). Exhaustive enumeration is comfortable in the shaded region below \(N \approx 30\) and hopeless beyond: by \(N = 100\) the sum has more terms than seconds since the Big Bang (\(\sim 4 \times 10^{17}\)), by \(N = 500\) more than atoms in the observable universe (\(\sim 10^{80}\)). The learning rule Equation 5.4 is one line; the negative phase inside it is this curve. The rest of the course is strategies for the region right of the shading.
Learning is easy where you average over data and intractable where you average over the model, and that gap is the partition function.
5.8 Outlook
We heated Week 2’s network and recovered Week 1’s distribution — the course’s two opening moves now joined in one machine. We asked that machine to learn and obtained a physically transparent learning rule: data correlations minus model correlations. And we derived, rather than asserted, why that rule cannot be run as written: its second term is \(\nabla_\theta \log Z\), an exponentially large sum, owed anew at every step — with a second difficulty, mixing, standing behind the first. Every training algorithm met from here on is a strategy for the negative phase.
The next lecture addresses the wall in two moves already named: the bipartite restriction that makes the clamped phase exact and lets whole layers sample in parallel, and contrastive divergence — a deliberately short, deliberately biased chain started at the data (Hinton 2002) — together with the question of why a truncated chain is allowed.
The negative phase exists because we differentiate \(\log Z\)with respect to the parameters: \(\nabla_\theta \log Z = \langle \cdot \rangle_\text{model} \neq 0\). In Week 10, score matching will fit the very same unnormalized energies by working instead with the gradient with respect to the configuration — and there \(\nabla_x \log Z = 0\), identically, because \(Z\) does not depend on where you evaluate the density (Hyvärinen 2005). It is the configuration-gradient of \(\log Z\) that vanishes, and shifting the derivative from \(\theta\) to \(x\) without losing the ability to learn is what makes the method work. The derivation comes in Week 10.
Ackley, David H., Geoffrey E. Hinton, and Terrence J. Sejnowski. 1985. “A Learning Algorithm for Boltzmann Machines.”Cognitive Science 9 (1): 147–69. https://doi.org/10.1207/s15516709cog0901_7.
Dayan, Peter, Geoffrey E. Hinton, Radford M. Neal, and Richard S. Zemel. 1995. “The Helmholtz Machine.”Neural Computation 7 (5): 889–904. https://doi.org/10.1162/neco.1995.7.5.889.
Gardner, Elizabeth. 1988. “The Space of Interactions in Neural Network Models.”Journal of Physics A: Mathematical and General 21 (1): 257–70. https://doi.org/10.1088/0305-4470/21/1/030.
Glauber, Roy J. 1963. “Time-Dependent Statistics of the Ising Model.”Journal of Mathematical Physics 4 (2): 294–307. https://doi.org/10.1063/1.1703954.
Hinton, Geoffrey E. 2002. “Training Products of Experts by Minimizing Contrastive Divergence.”Neural Computation 14 (8): 1771–1800. https://doi.org/10.1162/089976602760128018.
Hyvärinen, Aapo. 2005. “Estimation of Non-Normalized Statistical Models by Score Matching.”Journal of Machine Learning Research 6: 695–709.
MacKay, David J. C. 2003. Information Theory, Inference, and Learning Algorithms. Cambridge: Cambridge University Press.
Mehta, Pankaj, Marin Bukov, Ching-Hao Wang, Alexandre G. R. Day, Clint Richardson, Charles K. Fisher, and David J. Schwab. 2019. “A High-Bias, Low-Variance Introduction to Machine Learning for Physicists.”Physics Reports 810: 1–124. https://doi.org/10.1016/j.physrep.2019.03.001.
Welling, Max, Sirui Lu, and Lars Holdijk. 2026. Generative AI and Stochastic Thermodynamics: A Tale of Free Energies. Cambridge: Cambridge University Press. https://doi.org/10.1017/9781009709071.