19Score matching: differentiating past the partition function
Recommended reading
Core (~1 h).Hyvärinen (2005) — the founding score-matching paper, and the resolution of this course’s central obstruction in fifteen pages: the objective, the integration-by-parts theorem, and the consistency proof. Sections 2–3 are followed closely below. Alongside it, the energy-based-model sections of Mehta et al. (2019), for the physicist’s framing of unnormalized models.
Optional background.Vincent (2011) — denoising score matching: the practical variant, and the essential bridge to Week 12. Song and Ermon (2019) — the modern revival (NCSN): scores at many noise scales, generation by annealed Langevin; the direct ancestor of diffusion models. Song et al. (2020) — sliced score matching, the scalable estimator for the Jacobian-trace term. And your own Week 3 notes (Section 5.5) — the obstruction this lecture removes; worth re-reading for the contrast.
Prerequisite reminder. The energy-based model \(p = e^{-E}/Z\) and the Boltzmann distribution Equation 1.2 (Week 1); the negative phase \(\nabla_\theta \log Z\) and contrastive divergence (Section 5.5, Section 6.4 — Week 3); Langevin dynamics and its stationary law (Section 17.4 — Week 9, here transplanted to configuration space); integration by parts. New content: the score \(\nabla_x \log p\), the \(\nabla_x \log Z = 0\) removal, and Hyvärinen’s objective.
19.1 The partition function, revisited
Every module of this course has been shaped by the same object. Week 1 introduced the partition function \(Z = \sum_x e^{-E(x)}\) as the quantity that turns an energy into a probability, and flagged it as the recurring obstruction; Week 3 met the obstruction in earnest — the likelihood gradient of a Boltzmann machine needs \(\nabla_\theta \log Z\), the negative phase (Equation 5.5), an average over the model that no tractable computation supplies, and contrastive divergence approximated it at the cost of a bias (Section 6.4). Module 2 stopped fighting for \(\log Z\) exactly and bounded it, building the variational free energy (Equation 9.1) and everything through the VAE on that bound. Module 3 arranged for \(Z\) to cancel: the Metropolis rule needs only ratios (Section 15.3), and training itself turned out to be such a sampler. Each module found a different workaround, but none eliminated \(Z\) from the equations.
The present lecture removes it. The partition function is an integral over all configurations: a number. It depends on the parameters \(\theta\) — hence Week 3’s obstruction — but it does not depend on which configuration \(x\) you happen to be looking at. To the configuration variable, \(Z\) is a constant:
\[
\nabla_x \log Z \;=\; 0 .
\]
So the moment we differentiate \(\log p\) with respect to \(x\) rather than \(\theta\), the object that blocked energy-based learning disappears from the equations identically. Hyvärinen (2005) built an estimation method on this observation, score matching, which fits an unnormalized model to data without computing \(Z\); Vincent (2011) made it cheap (denoising); Song and Ermon (2019) turned it into state-of-the-art generation and set it on the road to diffusion. The idea is, in retrospect, straightforward: differentiate past the normalizer.
To fit \(p = e^{-E}/Z\) to data without computing \(Z\), one first fits the score\(\nabla_x \log p\) instead of the density — then \(Z\) drops out. Second, the remaining obstacle — that we do not know the score of the data either — falls to an integration by parts. What comes out is an exact, sampling-free objective for unnormalized models, and the object it estimates, the score, is precisely the drift a Langevin equation needs to generate.
19.2 Two gradients of one constant
The method rests on the choice between two derivatives of the same object. The parameter gradient \(\nabla_\theta \log Z = -\langle \nabla_\theta E \rangle_\text{model}\) is Week 3’s obstruction, the intractable negative phase that forced contrastive divergence (Section 5.5). The configuration gradient \(\nabla_x \log Z\) vanishes identically. Every gradient in the course carries a subscript for this reason.
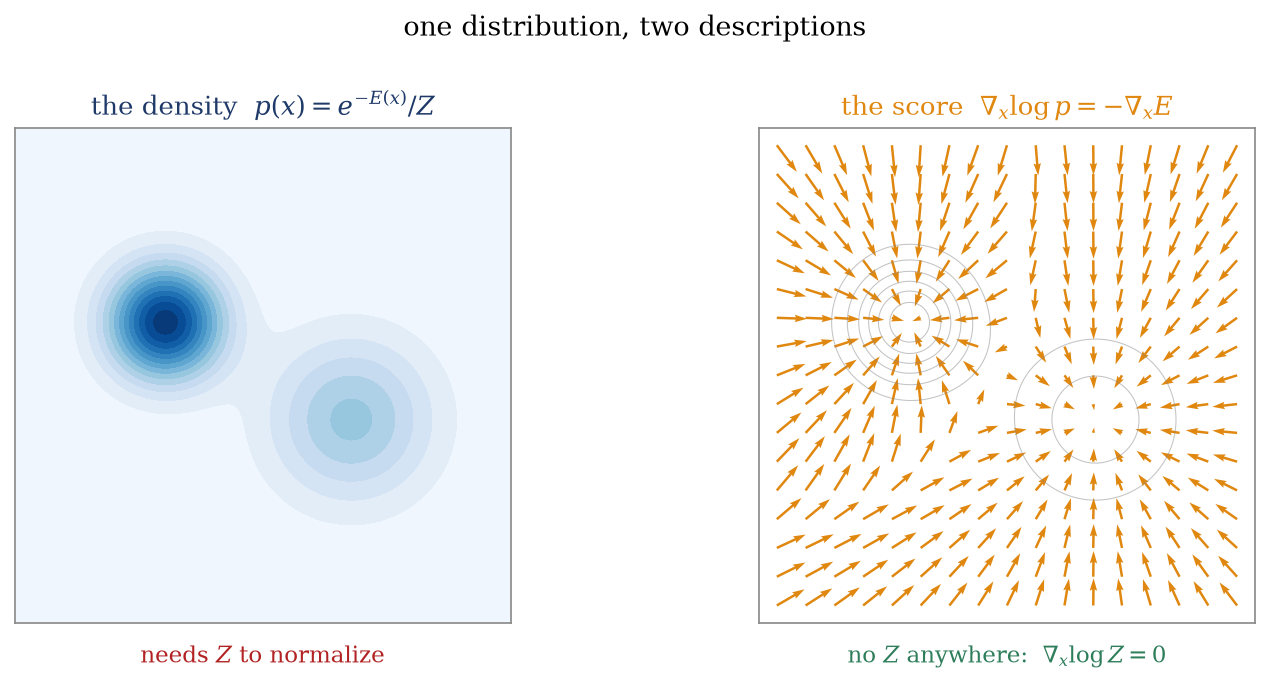
What does one gain by fitting \(\nabla_x \log p\) instead of \(p\)? Figure 19.1 shows the two descriptions of one and the same distribution. The density is a scalar field whose values must integrate to one — normalization is constitutive, and \(Z\) supplies it. The score\(s(x) = \nabla_x \log p(x)\) is a vector field: at every point, an arrow pointing in the direction of increasing log-probability — toward the data, everywhere. Arrows carry no normalization; scaling \(p\) by any constant leaves every arrow untouched. Up to the overall constant the score determines the distribution (integrate it back up), and a field of arrows toward the data is already a generator, because it is exactly the drift that Week 9’s Langevin equation needs to sample \(p\).
Figure 19.1: One distribution, two descriptions. Left: the density \(p(x) = e^{-E(x)}/Z\) of a two-mode distribution — a scalar field that must integrate to one, which is what the partition function is for. Right: the score \(\nabla_x \log p = -\nabla_x E\) of the same distribution — a vector field of arrows pointing toward the data (gray contours: the density), invariant under any rescaling of \(p\), hence independent of \(Z\). Score matching learns the right panel from samples; Langevin dynamics turns the right panel back into the left one.
A notational change: after serving as an Ising spin for six weeks, \(s\) now denotes the score — a gradient field over configuration space, ML’s standard symbol for it — and \(\sigma\) below is a noise scale, not a spin. The energy \(E(x)\) and its configuration gradient \(\nabla_x E\) are the objects of Weeks 1–3, unchanged.
19.3 The score is \(Z\)-free
For an energy-based model \(p_\theta(x) = e^{-E_\theta(x)}/Z_\theta\),
The score of an unnormalized model is the negative gradient of its energy — computable, for any energy you can write down, by a single differentiation, with no knowledge of \(Z\) whatsoever. Contrast this with what Week 3 needed. Maximum likelihood differentiates \(\log p_\theta\) in \(\theta\), and there \(\log Z_\theta\) does not drop out: \(\nabla_\theta \log Z_\theta = -\langle \nabla_\theta E_\theta \rangle_\text{model}\), the negative phase, an expectation under the very distribution we cannot sample cheaply (Equation 5.5). The two statements sit side by side:
To be precise about what has and has not been achieved: \(Z_\theta\) is not made zero — it still exists, still depends on \(\theta\), and still cannot be computed. A different derivative of it is zero, and score matching is the estimation method that only ever needs that derivative. The remaining question is what to match the model score against. The natural target is the score of the data — which we do not know either, since we have samples from \(p_\text{data}\), not its formula. Removing that second unknown is Hyvärinen’s theorem.
19.4 Hyvärinen’s theorem
The natural objective is to make the model’s score field match the data’s, in mean square under the data distribution — the Fisher divergence:
which vanishes exactly when \(s_\theta\) equals the data score (almost everywhere), so its minimizer recovers the true model when the family contains it (Hyvärinen 2005). As written it is useless: it contains \(\nabla_x \log p_\text{data}\), the score of an unknown density. Expand the square and note where the unknown sits,
the first term is pure model, the last is a constant we may discard, and only the cross term couples to the unknown. Write the expectation as an integral and use \(p_\text{data} \nabla_x \log p_\text{data} = \nabla_x p_\text{data}\):
integrating by parts in each coordinate, with the boundary terms vanishing provided \(p_\text{data}(x)\, s_\theta(x) \to 0\) at infinity (true for any decaying density and reasonable model; the regularity assumptions are stated in full in Hyvärinen (2005), and they can fail on bounded domains or heavy tails). The unknown data score is gone: differentiation has been moved from the data onto the model, where it can be evaluated. Reassembling,
an expectation over the data of two quantities computable at any sample point: the squared norm of the model score, and its divergence \(\operatorname{tr} \nabla_x s_\theta = \sum_i \partial s_{\theta,i} / \partial x_i\), the Laplacian of \(\log p_\theta\) when \(s_\theta = \nabla_x \log p_\theta\). For an energy-based model, using Equation 19.1, the objective reads
the mean squared force minus the mean Laplacian of the energy, evaluated on data points. The intractability of energy-based learning has been transformed: the negative phase — an average over the model, requiring sampling — has been replaced entirely by averages over the data, requiring only derivatives of the energy at the data points, with no \(Z\) and no Monte Carlo. The two removals compose: the configuration gradient deleted the normalizer, and integration by parts deleted the data score.
The change is in the divergence: score matching minimizes the Fisher divergence, not the KL divergence of maximum likelihood. The estimator is consistent — with a realizable model and enough data it recovers the same truth — but at finite samples the two weight errors differently (Fisher divergence is comparatively insensitive to getting the mixture weights of well-separated modes right, precisely because so little data sits between the modes). Score matching is therefore a different estimator from maximum likelihood.
Take-home 1
Two removals make an unnormalized model fittable from samples alone: the configuration gradient eliminates the partition function, and integration by parts eliminates the unknown data score. The objective minimizes the Fisher divergence rather than the KL, under mild boundary assumptions.
19.5 What score matching delivers, and the road to diffusion
The deliverable is a score, not a density. Score matching estimates \(-\nabla_x E\), equivalently the energy up to an additive constant — and that constant is exactly \(\log Z\), which the method neither recovers nor needs. You cannot evaluate \(p_\theta(x)\); you cannot compare likelihoods. What you can do is generate: the score is the drift of the configuration-space Langevin equation
whose stationary distribution is \(p_\theta\) — Week 9’s machinery (Equation 17.3) transplanted from parameters to data, with the learned arrows of Figure 19.1 doing the steering. A fitted score field is a working sampler of an unnormalized model. This structural fact is the module’s foundation: generation needs the score, not the density, and the score carries no normalizer.
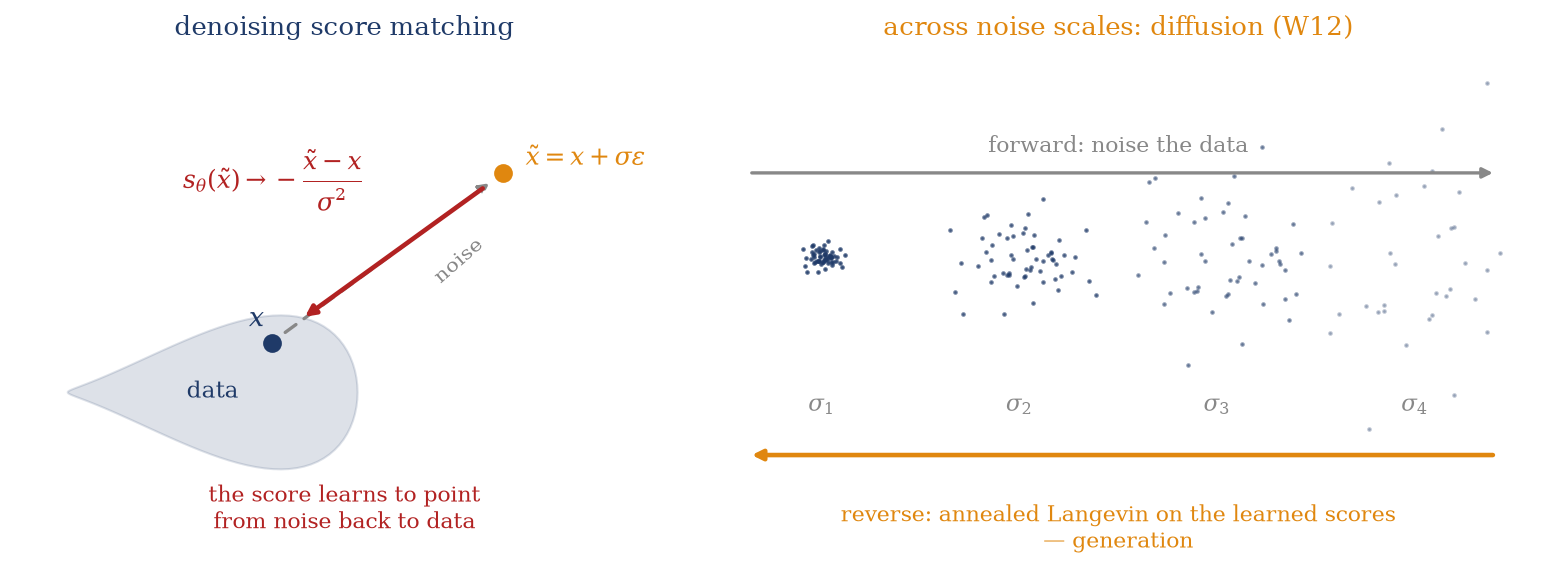
The cost, and the denoising fix. The divergence term in Equation 19.2 is the objection in high dimension: \(\operatorname{tr} \nabla_x s_\theta\) is a Jacobian trace, costing on the order of \(d\) backpropagations per data point. Vincent (2011) removed it. Perturb each data point with Gaussian noise, \(\tilde{x} = x + \sigma \varepsilon\), \(\varepsilon \sim \mathcal{N}(0, I)\), and match the score of the noised distribution \(q_\sigma\). The conditional score is closed-form, \(\nabla_{\tilde{x}} \log q_\sigma(\tilde{x} \mid x) = -(\tilde{x} - x)/\sigma^2\), and Vincent’s identity states that regressing on it is equivalent (up to a \(\theta\)-independent constant) to score-matching the noised marginal:
with minimizer \(s_\theta = \nabla \log q_\sigma\), the score of the data smoothed at scale \(\sigma\). (The identity is two lines: expanding the square, the cross term \(\langle s_\theta \cdot \nabla_{\tilde x} \log q_\sigma(\tilde x \mid x)\rangle\) collapses by \(\int \mathrm{d}x\, p_\text{data}(x)\, q_\sigma(\tilde x \mid x) \nabla_{\tilde x} \log q_\sigma(\tilde x \mid x) = \nabla_{\tilde x} q_\sigma(\tilde x)\) into the same cross term with the marginal’s score — no integration by parts, no Jacobian.) The objective is a task: the model is handed a noised point and trained to predict the direction back to the clean one — denoising. Matching scores and removing noise are the same problem (Figure 19.2, left). Sliced score matching (Song et al. 2020), which estimates the Jacobian trace with random projections, is the other scalable route; denoising is the one history chose.
The bridge to Week 12. A score learned at one small noise scale inherits a weakness of Langevin sampling itself: in the low-density regions between modes there is almost no data, the learned arrows are unreliable there (the example below catches this happening), and a sampler must cross exactly those regions to mix. The repair of Song and Ermon (2019) is to learn the score at many noise scales — heavily smoothed distributions have no empty regions — and generate by annealed Langevin: start from pure noise where the coarse score is trustworthy, and step down the noise ladder as the samples approach the data (Figure 19.2, right). Forward noising, a learned family of denoising scores, and a reverse pass from noise to data together make a diffusion model, with Equation 19.4 as the per-scale training loss. The next lecture supplies the missing mathematics — Anderson’s reverse-time SDE, which makes “run the noising backwards” an exact equation with the score as its only unknown — and Week 12 assembles the full machine.
Figure 19.2: Denoising score matching, and where it leads. Left: a data point \(x\) is perturbed to \(\tilde{x} = x + \sigma\varepsilon\) (gray dashed), and the score model is trained to point back, \(s_\theta(\tilde{x}) \to -(\tilde{x} - x)/\sigma^2\) (red): matching the score of noised data is denoising, with no Jacobian trace. Right: the same idea across a ladder of noise scales \(\sigma_1 < \dots < \sigma_4\): the forward direction noises data into a featureless cloud; generation runs the ladder in reverse by annealed Langevin on the learned scores (Song and Ermon 2019). Trained per scale by Equation 19.4, this is the structure of a diffusion model, Week 12’s subject.
Trap
Three standard errors. ① What vanishes is \(\nabla_x \log Z\), the configuration gradient. Week 3’s obstruction \(\nabla_\theta \log Z\), the parameter gradient, is not zero and never became zero; a different derivative of the same object vanishes. Conflating the two subscripts erases the logic of the course. ② Score matching delivers an unnormalized model: the energy up to an additive constant (\(= \log Z\)), a sampler (via Langevin), but never \(p_\theta(x)\) or a likelihood. ③ Hyvärinen’s integration by parts has fine print — boundary terms must vanish and the Fisher divergence is not the KL — so the exactness claim is “exact under stated assumptions, for a different divergence,” not “maximum likelihood for free.”
Take-home 2
Score matching yields the energy up to the constant \(\log Z\): the result can be sampled by Langevin dynamics but not evaluated as a density. Denoising score matching removes the Jacobian-trace cost, and learned across noise scales with annealed Langevin (Song and Ermon 2019) the score becomes a generator.
19.6 Example: a model fitted with no \(Z\)
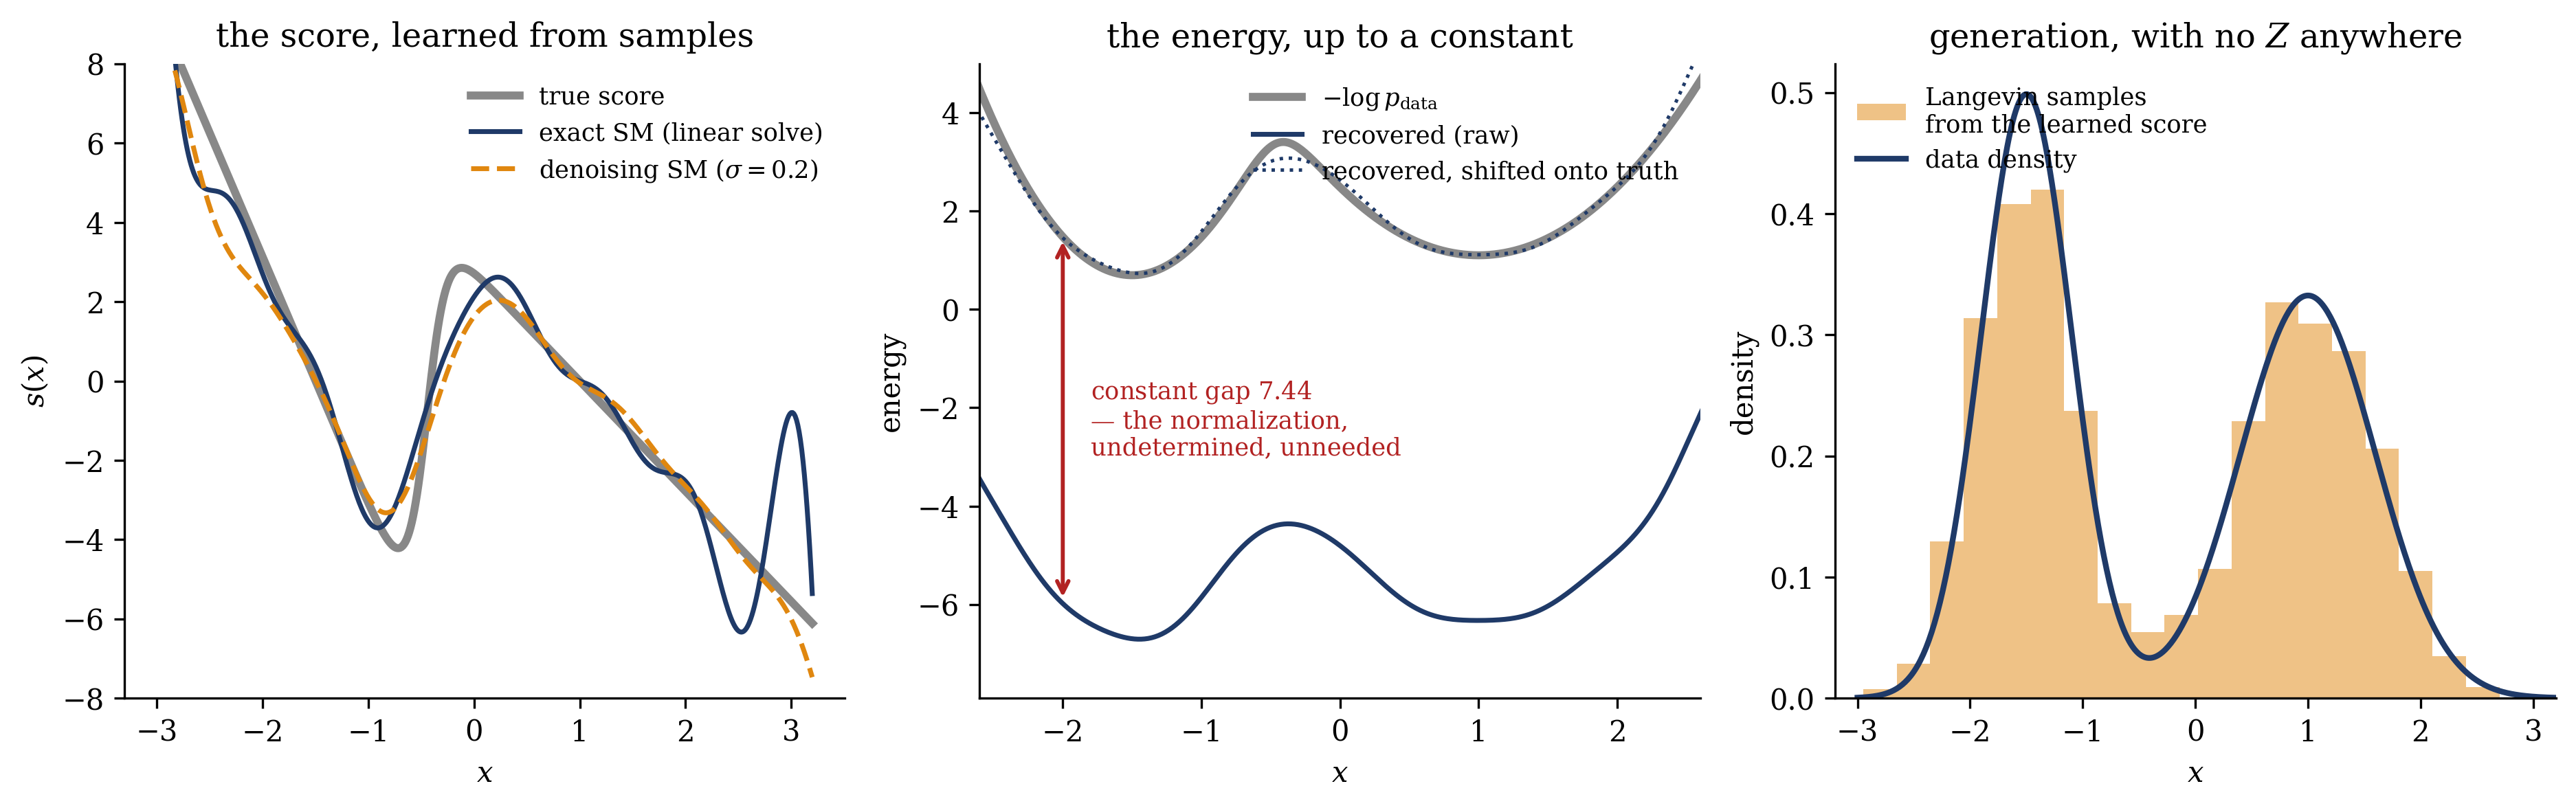
We now make the removal operational on the smallest nontrivial case, with an additional simplification: for a score model linear in its parameters, \(s_\theta(x) = \sum_k w_k \varphi_k(x)\) with fixed basis functions \(\varphi_k\), Hyvärinen’s objective Equation 19.2 is quadratic in \(w\), so exact score matching reduces to solving a linear system — no gradient descent and no neural network, the estimator in its purest form. Take \(5000\) samples from a two-mode Gaussian mixture, a basis of \(25\) Gaussian bumps, and fit three ways of looking at the same estimate (Figure 19.3).
The left panel is the estimator at work: the fitted score (navy) tracks the true mixture score (gray) closely wherever data lives, and denoising score matching at \(\sigma = 0.2\) (orange dashed) recovers essentially the same field — from noised samples, with no divergence term. Both fits wobble beyond \(|x| \gtrsim 2.5\), and the wobble is expected: score matching weights its objective by \(p_\text{data}\), so the score is simply unconstrained where the data does not go — the low-density blind spot that multi-scale noise (Week 12) exists to fix. In the middle panel, integrating the fitted score gives the energy, and the recovered curve runs parallel to the true \(-\log p\) — the vertical gap between them is constant up to an rms deviation of \(0.11\) across the data region. An additive constant is exactly what a gradient cannot see, and for \(p = e^{-E}/Z\) the normalization \(\log Z\) lives in that constant and is not recovered. In the right panel, Langevin sampling with the learned score as drift regenerates the data density, placing \(49.1\%\) of its samples in the left mode against the true \(50\%\) — generation from a model whose normalizer was never computed.
Figure 19.3: Score matching with no partition function, on \(5000\) samples from the mixture \(\frac{1}{2}\mathcal{N}(-1.5, 0.4^2) + \frac{1}{2}\mathcal{N}(1.0, 0.6^2)\), using a score model linear in \(25\) Gaussian basis functions (Hyvärinen’s objective is then quadratic — solved exactly by linear algebra). Left: the fitted score (navy) against the true mixture score (gray); denoising score matching at \(\sigma = 0.2\) (orange dashed) recovers the same field from noised samples with no divergence term. Both wobble outside the data region (\(|x| \gtrsim 2.5\)) — score matching is data-weighted, and the score is unconstrained where the density vanishes: the blind spot that motivates multiple noise scales (W12). Middle: integrating the fitted score recovers the energy up to an additive constant — the raw recovered curve (navy) runs parallel to the true \(-\log p\) (gray), their gap constant up to an rms deviation of \(0.11\) across the data region; that gap (the integration constant, where \(\log Z\) hides) is exactly the information score matching discards. Right: Langevin sampling with the learned score as drift regenerates the data density, with \(49.1\%\) of samples in the left mode against the true \(50\%\) — generation from a never-normalized model.
19.7 Outlook
The next lecture takes the reverse-time SDE up in full generality (Anderson’s 1982 result): a learned score is not merely a Langevin drift but the exact ingredient that inverts any diffusion — the mathematical basis of Week 12’s generative models.
The wider map of the module: Week 11 turns nonequilibrium thermodynamics itself into an estimator — the Jarzynski and Crooks fluctuation theorems (Jarzynski 1997; Crooks 1999) extract equilibrium free-energy differences from driven trajectories, annealed importance sampling being their ML incarnation — and Week 12 assembles diffusion models (DDPM, score-SDE (Ho, Jain, and Abbeel 2020; Song et al. 2021)) from a forward noising process (Week 9’s Fokker–Planck), a score learned by denoising (Equation 19.4), and a reverse-time equation (the next lecture).
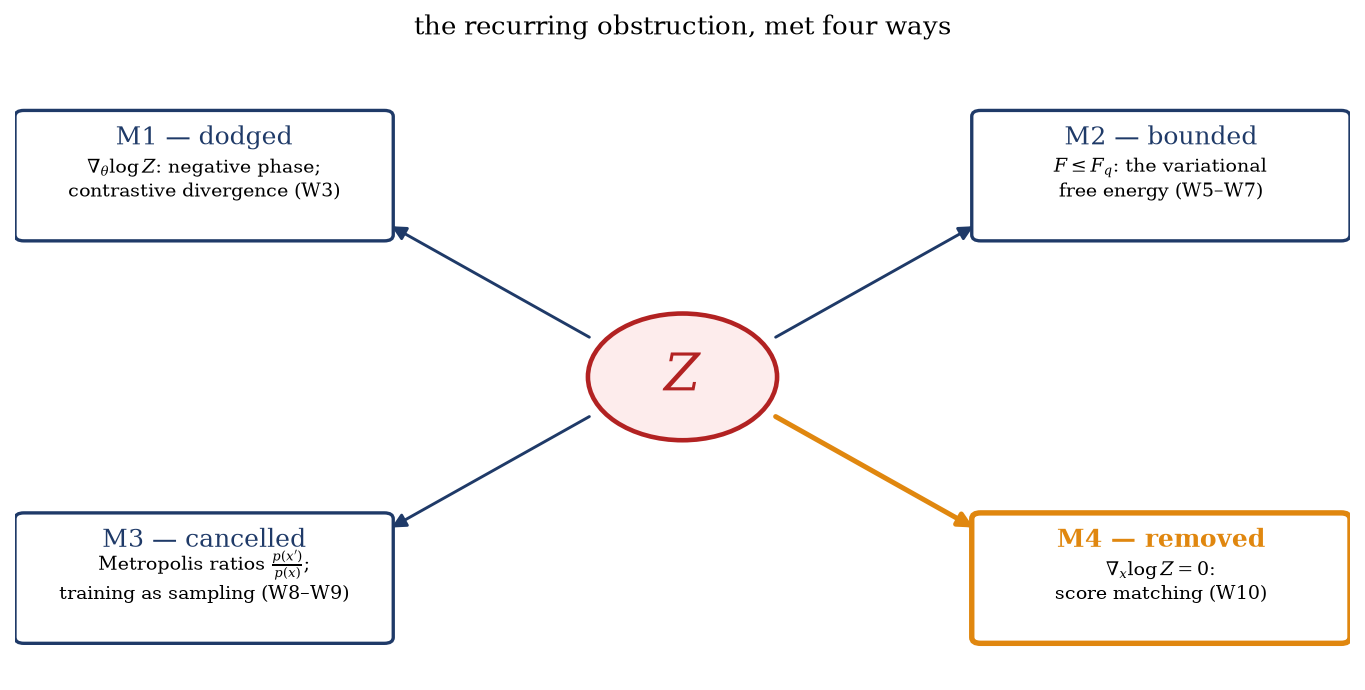
Figure 19.4 summarizes the course’s four encounters with \(Z\): approximated by contrastive divergence, which traded exactness for tractability; bounded by the variational free energy, which traded tightness for a guarantee; cancelled by Metropolis ratios, which traded closed forms for samples; and now removed by the configuration gradient, which traded the density for the score — and generation turns out not to need the density.
Figure 19.4: Four treatments of the partition function \(Z\), the recurring obstruction named in Week 1: approximated (Module 1: the negative phase \(\nabla_\theta \log Z\) forced contrastive divergence), bounded (Module 2: the variational free energy \(F \leq F_q\)), cancelled (Module 3: Metropolis ratios, training as sampling), and finally removed (Module 4: \(\nabla_x \log Z = 0\), score matching). The last gives up the normalization itself, which generative modeling does not need.
The partition function is constant in \(x\), so it drops out of the score.
Crooks, Gavin E. 1999. “Entropy Production Fluctuation Theorem and the Nonequilibrium Work Relation for Free Energy Differences.”Physical Review E 60 (3): 2721–26. https://doi.org/10.1103/PhysRevE.60.2721.
Ho, Jonathan, Ajay Jain, and Pieter Abbeel. 2020. “Denoising Diffusion Probabilistic Models.” In Advances in Neural Information Processing Systems. Vol. 33. https://arxiv.org/abs/2006.11239.
Hyvärinen, Aapo. 2005. “Estimation of Non-Normalized Statistical Models by Score Matching.”Journal of Machine Learning Research 6: 695–709.
Mehta, Pankaj, Marin Bukov, Ching-Hao Wang, Alexandre G. R. Day, Clint Richardson, Charles K. Fisher, and David J. Schwab. 2019. “A High-Bias, Low-Variance Introduction to Machine Learning for Physicists.”Physics Reports 810: 1–124. https://doi.org/10.1016/j.physrep.2019.03.001.
Song, Yang, and Stefano Ermon. 2019. “Generative Modeling by Estimating Gradients of the Data Distribution.” In Advances in Neural Information Processing Systems (NeurIPS). Vol. 32.
Song, Yang, Sahaj Garg, Jiaxin Shi, and Stefano Ermon. 2020. “Sliced Score Matching: A Scalable Approach to Density and Score Estimation.” In Proceedings of the 35th Uncertainty in Artificial Intelligence Conference (UAI), 115:574–84. PMLR.
Song, Yang, Jascha Sohl-Dickstein, Diederik P. Kingma, Abhishek Kumar, Stefano Ermon, and Ben Poole. 2021. “Score-Based Generative Modeling Through Stochastic Differential Equations.” In International Conference on Learning Representations. https://arxiv.org/abs/2011.13456.
Vincent, Pascal. 2011. “A Connection Between Score Matching and Denoising Autoencoders.”Neural Computation 23 (7): 1661–74. https://doi.org/10.1162/neco_a_00142.